March 13, 2010
727 584 7184
mlherbert@aol.com
Terry Hunt
Department of Anthropology
College of Social Sciences
University of Hawaii
2424 Maile Way
Saunders Hall 346
Honolulu, Hawaii 96822-2223
Tel: (808) 956-8415
Dear Terry Hunt:
I have read Collapse by Jarred Diamond, Questioning Collapse edited by Patricia A. McAnany and Norman Yoffee, Cambridge University Press, Cambridge 2010 and now Diamond’s review Two Views of Collapse, Jarred Diamond, NATURE vol. 463 no. 7283 February 18, 2010 page 880. Where formidable intellects collide even fools fear to tread yet I must rush in. Your quarrel is not great, and your subject is momentous. Each of you divulges priceless data. Would that you could work together.
First, let me give you a scrap of data, not my own but something I put together from the work of a host of experts. Here is the experience of Southern Mesopotamia from the beginning of history down to the twentieth century. Each civilization has been lumped into one of a half dozen fifty year increments depending on its age when it was replaced. On the vertical axis is the likelihood that a civilization which has entered that age bracket will depart it intact. The horizontal axis is the ages.
Information taken from R. H. Carling THE WORLD HISTORY CHART International Timeline Inc. Vienna, VA 1985. The experience of Southern Mesopotamia. The vertical axis is The chance of an empire of any age continuing to rule locally for another 50 years. The horizontal axis is the ages of the empires. I broke the Ottoman Empire into two, because their Janissary elite came from two different sources during the early and late empire.
In effect it is an actuarial table for civilizations. Life expectancy falls as the civilization ages just as with folks. At a glance one sees that the chance of survival falls according to a single rule. The line is cleaner than it is for a real actuarial table, even though the number of cases is comparatively extremely small. (Of course there are exceptions, which I shall not go into just now, but there don’t appear to be a significant number of exceptions in the geographical region.)
Looking a bit longer, we can quickly discount Diamond’s central thesis, which is that civilizations “choose” to thrive or fail. Were that the rule, then the line should go up. Foolish civilizations should fail quickly and the wise ones that survived should – since they are presumably just as wise as they were earlier – have a better chance of persisting than the average was at the beginning. Correct me if I’m wrong, but that line does not go up.
Your thesis, as regards the special case of Easter Island, (Sorry. You call it Rapa Nui. I have no idea what the locals called it in their heyday, so I will use the term used by Thor Heyerdahl who not only introduced me to the place in his book Kon Tiki, but actually answered a letter of mine. By this courtesy he so far exceeded the norm for famous people that I shall go to the mat for him any time any where.) is that the severe population decline in Easter Island was the result of European contact, something that the locals had no control of whatsoever and occurred utterly independent of the age of the local society. Were this the rule, civilizations undergo crisis because of events unrelated to their age, the line should be horizontal and very noisy. But the line is not horizontal and not noisy. It goes down.
So having ruled out intrinsic and extrinsic causes, we are left with the fact of there being a civilization at all. (Or whatever you want to call it … culture, society, urbanized population, elite executive class, dynasty … it’s all the same.) Civilizations die when they get too big, and die predictably. One rather pressing question is just how big is too big? And here you provide the desperately needed answer, or at least a good part of it. The maximum Easter Island population was three to five thousand. That is just on the edge of what can be survived, as we shall soon see. It is big enough to be imperiled. Safety must lie at a lower level but perhaps not much lower.
The second data set that is crucial harks back to a paper published earlier by our friend Diamond. He compared the number of occupied dwellings on an annual basis in Long House Valley in the American southwest with the thickness of tree rings in the valley. This is what he found:
Jared M. Diamond, “Life with the Artificial Anasazi,” NATURE, vol. 419 no. 6907, October 10, 2002 p 567.
The curves match so well that there appears to be no choice but to believe they are causally related. Diamond concludes that the population size is governed by rainfall. But there are a couple of problems with that. If the “modeled population,” by which he means tree ring thickness is limiting population size, then the Anasazi Indians who were living there spent a couple of centuries living beyond their means. In fact people were actually moving in (the vertical rises) when the people already there were starving. That seems improbable so I suspect these expert farmers were pruning and possibly cultivating trees.
Broadly speaking, the two of you are in agreement this time. The local society is at the mercy of events beyond their control. But look at the dates, from the time the numbers rose above a safe population of a few hundred to final extinction is three hundred years, just like the maximum for Mesopotamia. His graph also resolves something that had troubled me for years. Considering how fast the fertility of immigrants to the United States declines, we should be looking at a five generation cycle, not a ten generation cycle. In fact it appears that the primary cycle is a five generation one and the 300 year life span is a secondary cycle.
Now I make bold to insert your own graph of the Easter Island experience.
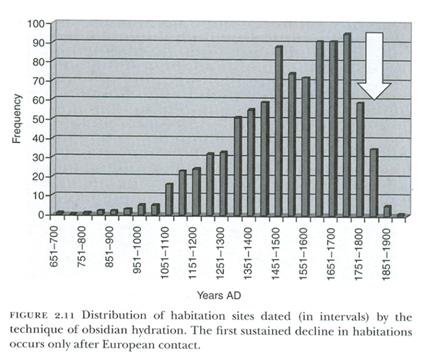
Chapter 2 Terry L. Hunt and Carl P. Lipo ”Ecological Catastrophe, Collapse, and the Myth of “Ecocide” on Rapa Nui,” Questioning Collapse, Cambridge University Press, Cambridge 2010.
It is positively creepy how well the two graphs match. Of course the time from growth beyond a stable small population to the time of collapse is twice as long as that in Long House Valley. Evidently on Easter Island it was possible to survive two secondary cycles. How is that? Well three possibilities come to mind. Perhaps the Long House Valley was actually significantly bigger than the population on Easter Island. Given the name of the valley, there may have been more people living in each house than Diamond gives them credit for. Or maybe Easter Island had tribes that retained some mating preference for their own. Or maybe it was those vertical lines again. The effective gene pool in Long House Valley may have been pooled from a number of similar villages while the population on Easter Island was entirely descended from the founders.
I doubt the Europeans had much impact on Easter Island. Certainly they had none in Long House Valley barring the implausible advent of Vikings or Knights Templar. On the other hand, I notice that we both consider a fifty year increment to be a jolly good way to measure the evolution of populations.
So I wish the two of you could shake on it. You have the same interest and parallel data. Together you could do mighty things.
Perhaps you are wondering why a big population must inevitably decline. It’s genetic, of course. The short version of that is on the enclosed DVD. There is much more at my website NoBabies.net, where I also post correspondence such as this. Let me know what you think. If there is anyway I can clarify further or help in any way, let me know.
Sincerely,
M. Linton Herbert MD
There have been 3,597 visitors so far.